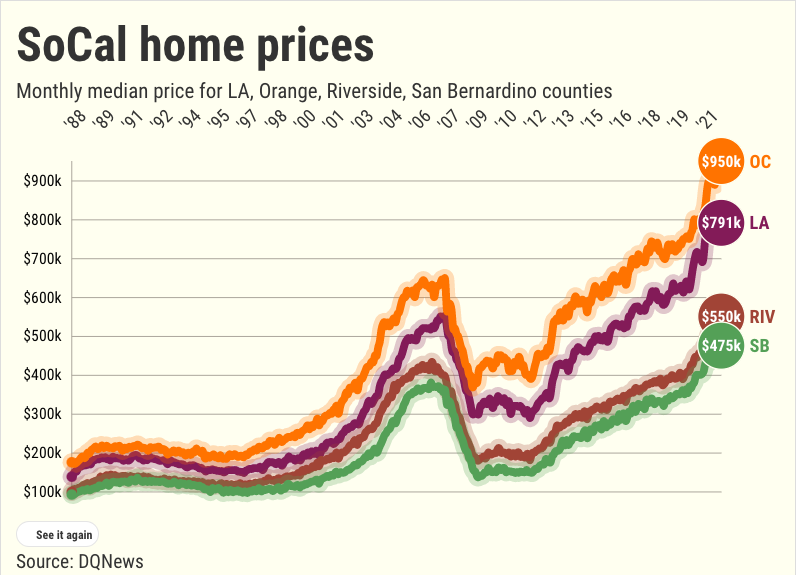
Orange County homebuying was mixed in January with sluggish sales that still managed to set a new record high.
Across Southern California, 16,461 residences — existing and newly constructed — sold in six counties, down 28% for the month, and down 8% over the past year, according to DQNews. The region’s median price of $687,000 was down 1% for the month, and up 16% over 12 months.
As for Orange County, here is what my trusty spreadsheet found within the DQNews report on closed transactions for January …
Sales
Month: 2,196 existing and new residences sold, down 26% from December and down 15% from January 2020.
How fast? This was the 22nd busiest January of the 35 since 1988.
Past decade: 1% above the 10-year average buying pace for January.
Monthly trend: Since 1988, a typical January sees a one-month sales drop all the time with an average 30% decrease from December.
Past 12 months? 41,109 Orange County purchases — 18% above the previous 12 months and 17% above the 10-year average.
Prices
January: The countywide $950,000 median for all homes was up 1.6% in a month and 19% over 12 months. This breaks the record $935,000 set in December.
Context: Over 10 years, price gains averaged 9.3% annually. The latest performance tops 90% of all 12-month periods since 1988.
Pandemic era? 13 price records broken since February 2020. The median’s $201,500 increase equals a gain of $11.97 every hour over these 23 months.
Key slices
Existing single-family houses: 1,397 sold, down 13% in a year. Median of $1,100,000 — a 23% increase over 12 months.
Existing condos: 674 sales, down 19% over 12 months. Median of $690,000 — a 23% increase in a year.
Newly built: Builders sold 125 new homes, down 18% in a year. Median of $1,285,750 — a 28% increase over 12 months.
Builder share: 5.7% of sales vs. 5.9% a year earlier. Orange County builders’ slice of the market ranks No. 3 among SoCal’s six counties.
Bigger picture
Rates: How cheap is money? Rates on a 30-year, fixed-rate mortgage averaged 3.21% in the three months ending in January vs. 2.74% a year earlier. That translates to 6% less buying power for house hunters.
Payments: At these rates, a buyer with 20% down would pay $3,290 a month on the $950,000 median sale vs. $2,723 on February 2020’s $748,500 median. So during the pandemic era, sale prices rose 27%, but house payments were up just 21%.
Supply: In the past year, L.A.-O.C. had 41% fewer listings, the ninth-biggest drop of 50 largest metropolitan areas, according to Realtor.com.
Affordability: The share of households that can afford the local median-priced house dropped to 17% vs. 26% in 2019, according to the California Association of Realtors.
Jonathan Lansner is the business columnist for the Southern California News Group. He can be reached at jlansner@scng.com
Related Articles
Did the pandemic kill homeownership?
Orange County housing adds 16 million-dollar ZIPs, loses 13 ‘bargain’ neighborhoods
18% of US homes bought by investors, highest this century
2021 home-price jumps: 19.2% in LA-Orange County, 19.8% nationally, says Case-Shiller
U.S. new-home sales decline for first time in three months
