“Numerology” tries to find reality within various measurements of economic and real estate trends.
Buzz: Southern California home prices are now 10% off their May 2022 peak.
Source: My trusty spreadsheet reviewed CoreLogic’s monthly median home price stats dating to 1988 for the six Southern California counties.
Fuzzy math: Some market watchers have hinted that recent price weakness may be more of a seasonal downswing than a true depreciation trend – as homebuying is often thought to cool from spring to winter.
Topline
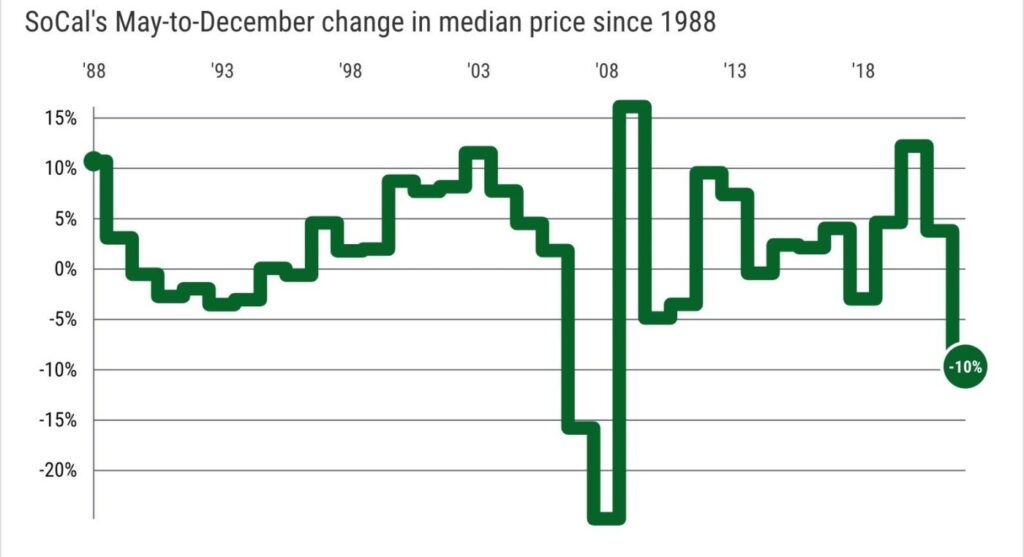
The 2022 drop in the six-county median selling price from May’s record-high $760,000 to December’s $686,000 is the third-largest percentage drop in this seven-month period over the past 35 years.
The top drops came in the last bubble-bursting era. The No. 1 price tumble was in 2008 when prices fell 25% in these seven months. No. 2 happened in 2007, when prices fell 16%.
OK, maybe 2022 isn’t “2008” … but it’s still very historically ugly!
Details
Price drops in this seven-month period aren’t typical.
Over 35 years, declines in May-to-December occurred 13 times. Values rose 21 times and were flat in 1995.
In fact, there were double-digit gains four times – in 2009 (up 16%), 2020 (up 12%), 2003 (up 11%) and 1988 (up 11%).
And the 2022 late-year stumble compares to only two price drops in the previous 10 years in the same timeframe – 2014’s 0.5% decline and 2018’s 3% dip.
It adds up to this: Since 1988, the average May-to-December price change is a 2% gain.
Bottom line
Look, 2022’s ugly ending – seven straight months of declining prices – is clearly not a seasonal downswing.
Related Articles
Los Angeles-Orange County homebuying plummets 44% to record low
Inland Empire homebuying tumbles 45% as payments jumped by 50%-plus
What if stocks were tracked like home prices?
Southern California’s hottest real estate stories of 2022
Will California’s economy ‘bowl’ over into a 2023 recession?
Rising mortgage rates combined with overpriced homes created affordability challenges. Toss in some economic uncertainties. It was a recipe that sent Southern California house hunters running away from the market.
May-to-December’s 112,209 Southern California home sales in 2022 were the second-slowest for the period since 1988. Only the bubble era’s 2007 was slower. And 2022’s buying pace was 32% below average.
Locally speaking
How did May-to-December pricing look in the six counties with historical context?
Los Angeles: The 10% price drop in 2022 over seven months ranked as the third-worst descent since 1988. L.A.’s average May-to-December over 35 years produced a 1% gain with only 14 declines.
Orange: 11% drop, ranking No. 2 since 1988. Average May-to-December is a 1% gain with 14 declines.
Riverside: 8% drop, ranking No. 3 since 1988. Average May-to-December is a 4% gain with 9 declines.
San Bernardino: 6% drop, ranking No. 3 since 1988. Average May-to-December is a 4% gain with 11 declines.
San Diego: 11% drop, ranking No. 3 since 1988. Average May-to-December is a 2% gain with 13 declines.
Ventura: 7% drop, ranking No. 4 since 1988. Average May-to-December is a 1% gain with 15 declines.
Jonathan Lansner is the business columnist for the Southern California News Group. He can be reached at [email protected]
