
If shoppers look really hard, they might find a sliver of relief in July’s Consumer Price Index — the biggest one-month drop in this cost-of-living yardstick since the early days of the pandemic.
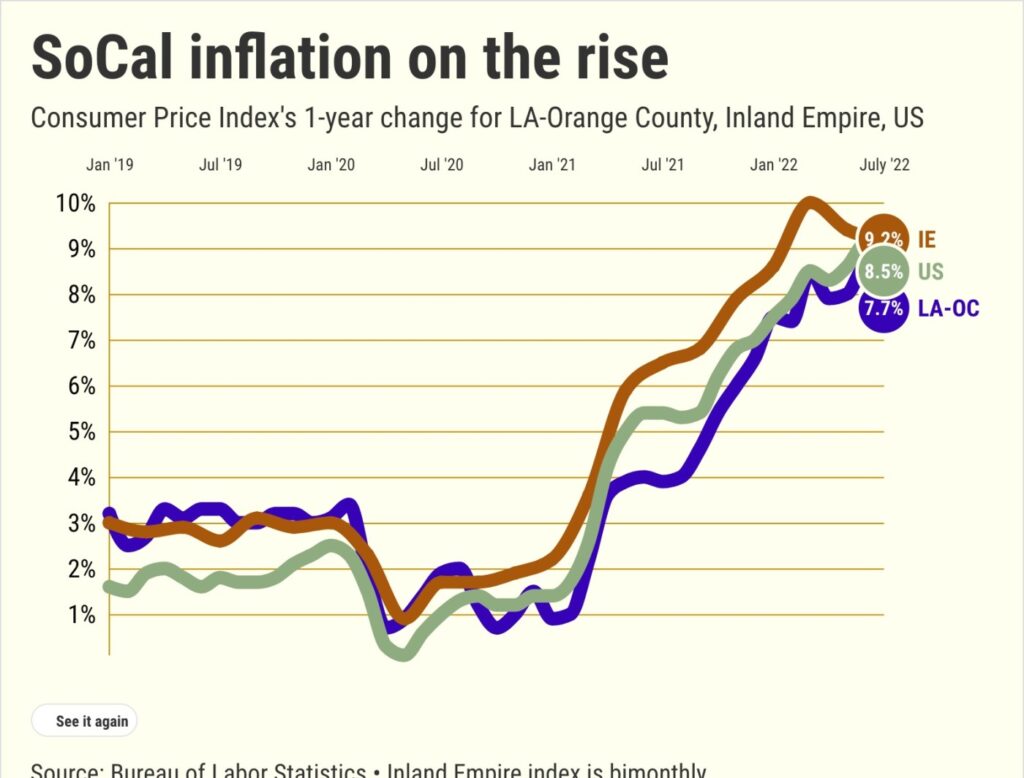
Despite a modest slowing in July, inflation is at heights last seen in the 1980s. Consumer prices are jumping in the Inland Empire at a 9.2% annual rate and 7.7% in Los Angeles and Orange counties. And nationally, CPI was up at an 8.5% rate.
But at least for one month, the cost of living’s swift upswing has slowed one smidge.
L.A.-O.C. inflation is down from 8.6% in June — the largest one-month dip since April 2020 when a pandemic lockdown dropped the economy. U.S. inflation fell from 9.1% — also the largest decline in 27 months. And the Inland Empire’s bimonthly index showed a slowing from its last reading at 9.4% in May.
One key factor is gasoline, that’s now priced under $5 a gallon in some parts of Southern California. The CPI said pump prices were down in July by 6.2% in L.A.-O.C. and 5.7% in I.E. Still, fueld is 38% pricer in a year.
So, a minor improvement in the inflation rate cannot sugar coat escalating prices fueled by “too much good stuff.” Government stimulus overheated an economy rapidly recovering from a coronavirus chill. Add to that shortages of workers and raw materials and an overwhelming global supply chain.
Inflation is still sky-high. A year ago, L.A.-O.C.’s cost of living was rising at a 3.9% annual pace, the Inland Empire was up 6.5% and the U.S was 5.4%. And two years ago — when lockdowns iced the economy — inflation was minimal: L.A.-O.C. at 1.9%, Inland Empire at 1.7% and 1% for the U.S.
Don’t forget one economic bright spot that dulls some of inflation’s pain — a strong job market.
Southern California bosses added 400,000 jobs in the 12 months ended in June, bringing the region to 99% of its pre-pandemic employment. In that year, local wages rose 5.7% — up from the 3.4% averaged in pre-pandemic 2015-19, according to the Employment Cost Index.
Of course, the improving employment picture does not fully compensate for soaring inflation. And, do not forget, many bosses pass along those higher wages to their customers — yet another inflation factor.
Remember, inflation is carefully watched by the Federal Reserve. The central bank has hiked interest rates four times already this year as a way to cool the surge in the cost of living. So whether the CPI’s small changes mean much to your bank accounts, it’s more than noteworthy to the Fed. So July’s dip could ease the size of future rate hikes.
But no matter the trends, inflation’s hit to the wallet is significant. Here’s how Southern California inflation broke down in key consumer-spending categories. By CPI math we look at what’s up in the past year in Riverside and San Bernardino counties compared with the L.A.-O.C. metro area.
Food …
Groceries: 11.4% inland vs. 11.6% coastal.
Dining out: 10% inland vs. 6.3% coastal.
Alcoholic beverages: 6.4% inland vs. 5.3% coastal.
Housing …
Rent: 8.8% inland vs. 4.3% coastal.
Household energy: 17.7% inland vs. 13.6% coastal.
Household furnishings/operations: 9.4% inland vs. 9.5% coastal.
Transportation …
New vehicles: 5% inland vs. 8.2% coastal.
Used cars and trucks: Both regions at 7.4%.
Other purchases …
Apparel: 11.3% inland vs. 4.2% coastal.
All services: 7% inland vs. 5.7% coastal.
Medical care: 5.7% inland vs. 8.9% coastal.
Recreation: 1.2% inland vs. 4.1% coastal.
Tuition/child care: 1.6% inland vs. 11.9% coastal.
PS: Look at an odd metric — the cost-of-living minus food and energy — that is watched by many economists, notably at the Fed, to track “core” inflation. In the past year, it’s up 6.2% inland vs. 5.7% coastal.
Recent Comments