Can falling mortgage rates – whenever that happens – revive homebuying in San Bernardino County?
How slow is it? Consider that in the 12 months ended in August, 28,810 San Bernardino County residences sold, according to CoreLogic. That’s 34% below the homebuying pace of two years earlier.
This drop can be linked to drastically falling affordability in the pandemic era.
August’s median price of $495,000 – the fourth-highest ever – is up 41% since February 2020. Meanwhile, mortgage rates went from 3.5% to 7.1%. A typical San Bernardino buyer saw house payments surge 112% to $2,661 monthly, assuming a 20% downpayment.
My trusty spreadsheet reviewed how homebuying moved with big rate swings dating back to 1988. This 416-month span was sliced into thirds – ranking the results by one-year moves in the average 30-year fixed mortgage rate from Freddie Mac.
We contrasted the periods when rates surged the fasted vs. times when mortgages tumbled the most. Both groupings averaged 1 percentage-point moves over 35 years.
The swings
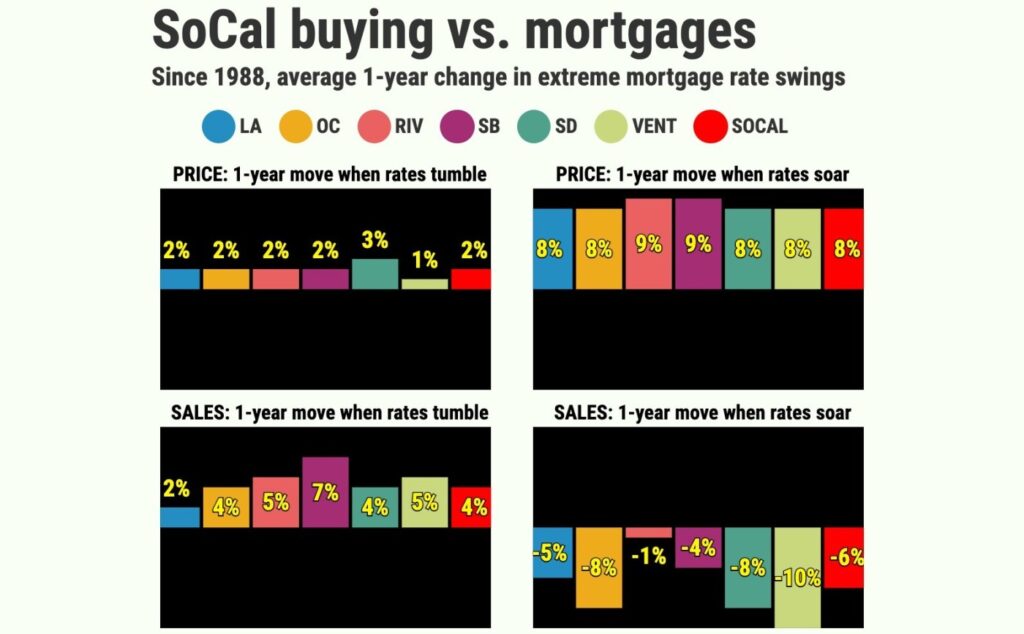
Ponder how San Bernardino homebuying gyrates during these rate-swing extremes since 1988.
Start with pricing. When mortgages were in their steepest jumps, home values in San Bernardino averaged 9% one-year gains.
Yet when mortgages were in their steepest drops, median home prices in San Bernardino had 1.5% gains.
By the way, the local median price has appreciated 4.6% since 1988. So cheaper financing for house hunters could mean softer pricing, too.
And falling rates modestly boost the San Bernardino sales pace, historically speaking.
The largest rate drops came with 6.9% one-year gains in the number of closed transactions.
When rates increased rapidly, however, the sales pace fell – averaging 4.1% one-year losses.
The secret sauce
There’s a catch to lower rates – housing’s three magic words: “Jobs, jobs, jobs.”
Rates are usually rising when the overall economy is strong – even too strong – and hiring is plentiful. Remember, you need a solid paycheck to be a successful house hunter.
Yet rates tend to dip when the economy is sour, and that’s not a great backdrop for a major purchase such as a home. So, let’s peek at California’s job market since 1988.
When rates surged over the past 35 years, California employment grew at a 2.7%-a-year pace. But jobs shrank at a 0.7% annual pace when rates tumbled.
Bottom line
This isn’t just some local housing quirk. Falling rates come with pricing weakness in many places.
Across the six-county Southern California region, the sharpest rate jumps were in step with 8% average one-year price gains. The largest rate drops came with 2% average price gains.
And nationally, soaring rates meant an average 7.5% one-year gain in the Case-Shiller US index vs. 2% appreciation when rates were cascading.
History is not a forecast. And maybe it’ll be different this time. But 35 years is a good guide to what’s possible.
Jonathan Lansner is the business columnist for the Southern California News Group. He can be reached at jlansner@scng.com
Leaving California?
Which state ‘culture’ is your best alternative?
Where do ‘best state’ rankings tell you to move?
What states are the safest places to live?
Here are the healthiest states to consider
If you want ‘fun’ lifestyle, here are states to move to
States with the strongest job markets
What state is the best bargain?
Related Articles
Will mortgage rate cuts end Riverside County’s homebuying slump?
Will lower mortgage rates revive Los Angeles County’s housing market?
Will rate cuts rescue Orange County’s homebuying slump?
Leaving California: What’s the best state to move to in 2023?
Will Southern California home prices dip in the ‘off’ season?
