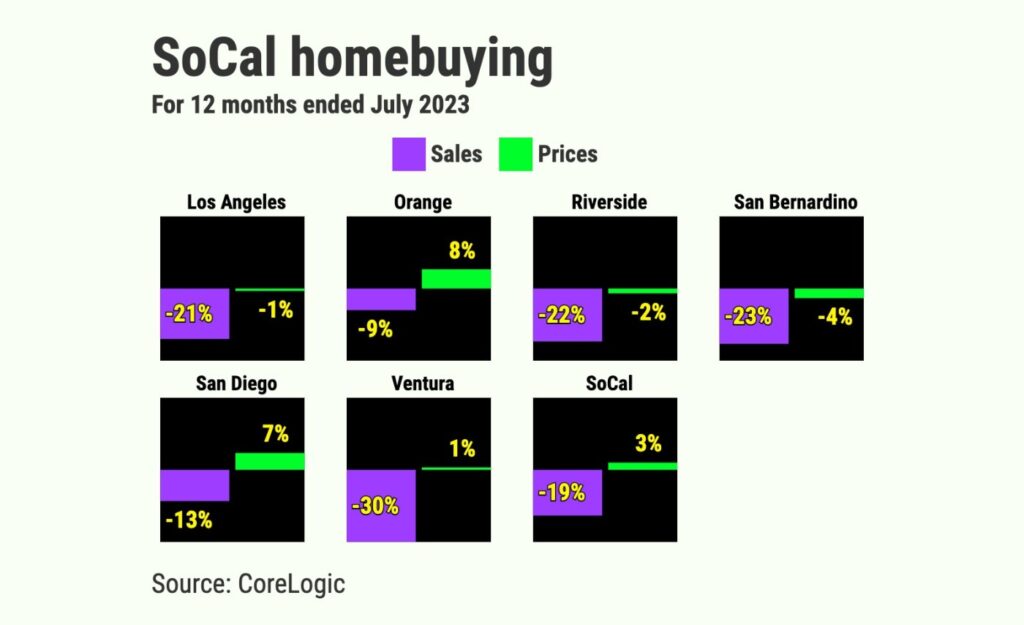
Homebuying in Riverside and San Bernardino counties is running one-third below the mid-summer norm.
Inland Empire home purchases totaled 4,541 in July in the two counties, according to CoreLogic. That’s down 18% for the month and down 22% for the year. How slow is that?
No. 5 slowest-selling July in records dating to 1988.
Only 17% of all months have been slower.
32% below the average July sales pace since 1988.
41% below the red-hot, mid-pandemic. July 2021.
Past 12 months? 79,119 sales, sales, 17% below average.
This year has seen house hunting drastically pull back. Lofty rates cut buying power by 14%. Limited buying options also hindered sales. So, across the six-county Southern California region, sales fell 19% in a year to 13,998.
Affordability was also hurt by pricing. The six-county region’s median sales price increased 2.5% to $743,000 – 1% off the $750,000 record set in April 2022.
The basics
Let’s look inside the Inland Empire market, by county, starting with July sales.
Riverside had 2,641 closings, down 20% in a month and 22% lower in a year. San Bernardino had 1,900 sales — down 16% in a month and 23% lower in a year.
Next, consider how prices moved.
In Riverside, $551,250 median was down 1.6% in a month and 2% lower in a year. That’s 5% off the $581,500 record set in August 2022.
In San Bernardino, $480,000 median — up 1.1% in a month and 4% lower in a year. That’s 4% off the $500,000 record set in May 2022.
Payment pain
Pricier financing is a factor as the 30-year mortgage averaged 6.84% in July vs. 5.41% 12 months earlier. Here’s how that hit homebuying costs, by county …
My trusty spreadsheet tells me Riverside buyers got an estimated house payment that’s 14% pricier – $2,887 per month on the $551,250 median vs. $2,532 on a year ago’s $563,100 home. And that’s assumes having $110,250 for a 20% downpayment.
In San Bernardino, buyers got 12% bigger payment – $2,514 monthly on the $480,000 median vs. $2,249 on a year ago’s $500,000 home. The downpayment was $96,000 or 20%.
Single-family homes
Sales: Riverside’s 1,840 transactions were down 19% in a month and 22% lower in a year. San Bernardino’s 1,505 closings were down 14% in a month and 21% lower in a year.
Prices: Riverside’s $565,000 median was down 2% in a month and flat in a year. San Bernardino’s $480,000 median was up 2% in a month and 3% lower in a year.
Condos
Sales: Riverside’s 351 sales were down 14% in a month and 8% lower in a year. San Bernardino’s 114 sales were down 21% in a month and 26% lower in a year.
Prices: Riverside’s $459,000 median was down 3% in a month and 2% higher in a year. San Bernardino’s $500,000 median was up 6% in a month and 5% higher in a year.
New homes
Sales: Riverside builders sold 341 units — down 31% in a month and 35% lower in a year. San Bernardino’s 155 new residences sold were down 35% in a month and 40% lower in a year.
Prices: Riverside’s $581,500 new-home median was up 1% in a month and 4% lower in a year. San Bernardino’s $575,500 median was up 1% in a month and 10% lower in a year.
Builder share: In In Riverside, new homes were 12.9% of all closings last month compared to 15.5% 12 months earlier. San Bernardino’s 8.2% new-construction share last month compares to 10.4% 12 months earlier.
Jonathan Lansner is the business columnist for the Southern California News Group. He can be reached at jlansner@scng.com
REAL ESTATE NEWSLETTER: Get our free ‘Home Stretch’ by email. SUBSCRIBE HERE!
Leaving California?
Which state ‘culture’ is your best alternative?
What states are the safest places to live?
Here are the healthiest states to consider
If you want ‘fun’ lifestyle, here are states to move to
States with the strongest job markets
What state is the best bargain?
Related Articles
US home prices a very split picture, Case-Shiller index shows
Southern California home prices near record high despite sales plunge
This Bay Area city makes list of hottest ZIP codes in U.S. for home buyers — but Bakersfield has it beat
California house hunters face record $4,359 monthly payment
Home prices dip in 35 Orange County ZIPs. How did your neighborhood fare?
