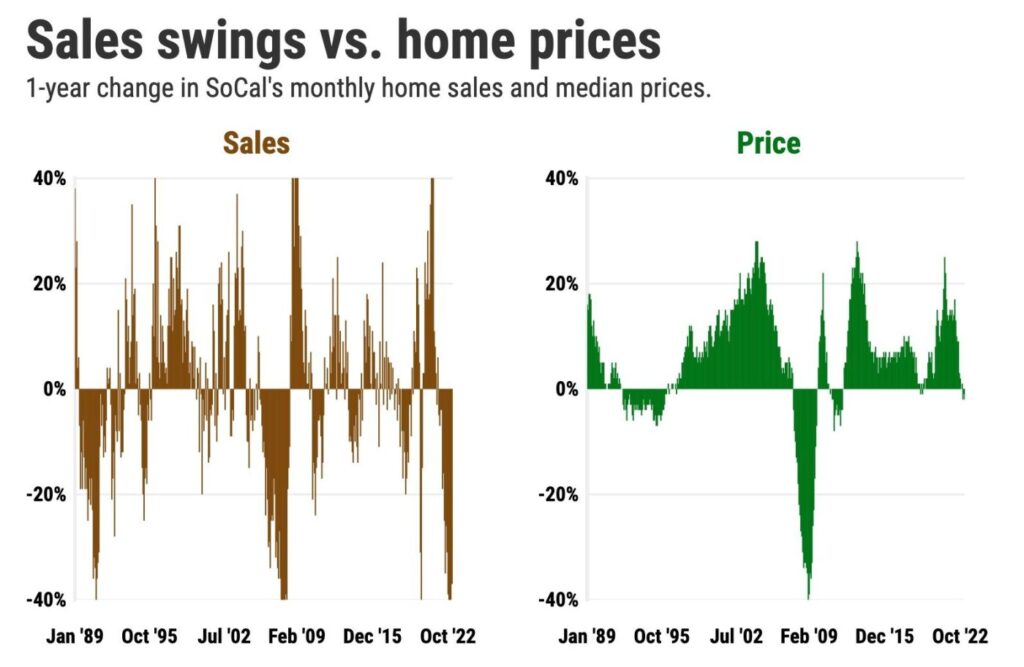
Homebuying in Riverside and San Bernardino counties ran at the ninth-slowest March pace on record despite a noteworthy seasonal jump in closed transactions from February.
Inland Empire home purchases totaled 5,121 in March, according to CoreLogic. That’s up 31% for the month but down 41% for the year.
How slow is that?
No. 9 slowest-selling March in records dating to 1988.
45th-smallest sales total for any month.
23% below the average March
Yes, some house hunters returned to the market in early 2023 despite economic skittishness and lofty mortgage rates that have cut buying power by 23% in a year. Still, sales In the six-county Southern California region in the past year fell by 37% to 15,307 – the second-slowest March on record. The six-county median sales price fell 2.1% to $705,000.
The basics
Let’s look inside the Inland Empire market, starting with March sales.
Riverside County had 3,154 closings, up 35% in a month but 39% lower in a year. San Bernardino County had 1,967 sold — up 25% in a month but 43% lower in a year.
Note: A March sales bump is little surprise. Since 1988, sales have grown from February by an average 36% in Riverside and 30% in San Bernardino.
Next, consider how prices moved.
In Riverside County, the $535,750 median was down 0.8% in a month and 5% lower in a year. It’s also 10% off the $598,500 record high set in April 2022.
San Bernardino County had a $480,000 median — up 1.1% in a month and 1% higher in a year. It’s also 8% off the $523,000 peak of May 2022.
Since 1988, the average March has had prices gaining 1.7% in Riverside for the month and advancing 1.3% in San Bernardino.
Payment pain
Pricier financing is a factor: The 30-year mortgage averaged 6.54% in March vs. 4.17% 12 months earlier.
My trusty spreadsheet tells me Riverside County buyers got an estimated house payment that’s 24% pricier – $2,720 per month on the $535,750 median vs. $2,197 on a year ago’s $563,500 home. And that assumes having $107,150 for a 20% downpayment.
In San Bernardino County, buyers got a 32% bigger payment – $2,437 monthly on the $480,000 median vs. $1,852 on a year ago’s $475,000 home. That’s needs $96,000 for a 20% downpayment.
Single-family homes
Sales: Riverside County’s 2,163 transactions were up 34% in a month but 41% lower in a year. San Bernardino County’s 1,508 closings were up 27% in a month but 44% lower in a year.
Prices: Riverside County’s $543,750 median was up 1% in a month but 6% lower in a year. San Bernardino County’s $470,000 median was up 4% in a month and flat in a year.
Condos
Sales: Riverside County had 404 sold — up 47% in a month but 28% lower in a year. San Bernardino County had 95 sold — up 20% in a month but 53% lower in a year.
Prices: Riverside County’s $490,000 median was up 8% in a month and 5% higher in a year. San Bernardino County’s $495,000 median was up 8% in a month and 1% higher in a year.
New homes
Sales: Riverside County builders sold 487 units — up 28% in a month but 37% lower in a year. San Bernardino County had 224 new residences sold — up 1% in a month but 38% lower in a year.
Related Articles
Competition for housing heats up as Southern California listings plunge
March miracle? California home prices rebound 7.6%
Home values drop in more than half of US off pandemic peaks
California’s housing bubble pops as Fed shuts the pump
San Francisco the biggest loser as US home prices slip 7 straight months
Prices: Riverside County’s $571,750 new-home median was down 4% in a month and 1% lower in a year. San Bernardino County’s $600,000 median was up 2% in a month and 5% higher in a year.
Builder share: In Riverside County, new homes were 15.4% of all closings last month compared with 15.1% 12 months earlier. San Bernardino County’s 11.4% share last month compares to 10.4% 12 months earlier.
Jonathan Lansner is the business columnist for the Southern California News Group. He can be reached at jlansner@scng.com
