
The pandemic shuffled Southern California’s job market as the rebound from lockdowns was, in no way, equal across the board.
My trusty spreadsheet tells me that bosses in Los Angeles, Orange, Riverside and San Bernardino counties averaged 7.8 million jobs in the past year. That’s up 70,000 workers from pre-pandemic 2018-19 – or a 1% increase.
But the return of workers who lost their jobs amid coronavirus-related business limitations has been uneven by industry.
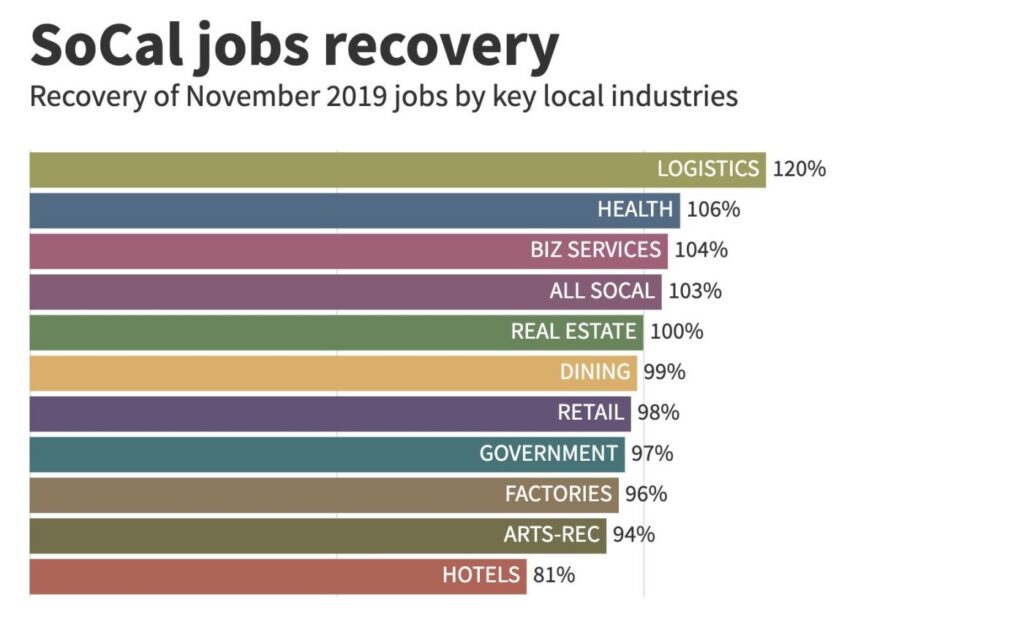
Let’s ponder Southern California’s hiring split, looking at staffing in 10 key employment categories and comparing average staffing in the 12 months through November vs. the 2018-19 average.
Hot jobs? There were 224,000 total job gains in transportation/warehouses, health/personal services, business services and construction-real estate-finance.
Cold spots? There were 126,000 fewer workers combined in restaurants, hotels, arts-entertainment-recreation, retailing, manufacturing and government.
That combination has changed what work is available in the local job market. Here are the winners and losers by industry and their share of the local workers …
Transportation/warehouses: The red-hot logistics business had 5.9% share of local jobs in the past 12 months vs. 4.6% in 2018-19, a 1.3 percentage-point rise. The industry’s 457,500 local jobs are up 100,000 workers from pre-pandemic 2018-19 – or a 28% increase.
Health and personal services: 15.3% share of local jobs vs. 14.5% in 2018-19, a 0.8-point rise. The 1.19 million jobs are up 73,000 workers from 2018-19 – or a 6.5% increase.
Business services: 15% share of local jobs vs. 14.5% in 2018-19, a 0.5-point rise. The 1.17 million jobs are up 49,000 workers from 2018-19 – or a 4.4% increase.
Construction, real estate, finance: 8.5% share of local jobs vs. 8.6% in 2018-19, a 0.1-point decline. The 664,000 jobs are up 2,400 workers from 2018-19 – or a 0.4% increase.
Arts, entertainment and recreation: 2% share of local jobs vs. 2.2% in 2018-19, a 0.2-point decline. The 157,400 jobs are down 12,300 workers from 2018-19 – or a 7.3% dip.
Retailing: 9.5% share of local jobs vs. 9.7% in 2018-19, a 0.2-point decline. The 743,100 jobs are down 11,000 workers from 2018-19 – or a 1.4% dip.
Related Articles
Twitter layoffs continue under Elon Musk
$140,000 job on lighthouse comes with San Francisco views, room and board — but there’s a catch
Southern California adds below-average 55,600 workers in November
Orange County facing short, deep recession, Chapman forecast says
Commentary: Is computer programming a ‘dirty job’?
Hotels: 1% share of local jobs vs. 1.2% in 2018-19, a 0.2-point decline. The 75,000 jobs are down 20,000 workers from 2018-19 – or a 21% dip.
Restaurants: 8.4% share of local jobs vs. 8.7% in 2018-19, a 0.3-point decline. The 658,500 jobs are down 18,000 workers from 2018-19 – or a 2.6% dip.
Manufacturing: 7.3% share of local jobs vs. 7.8% in 2018-19, a 0.5-point decline. The 570,000 jobs are down 32,000 workers from 2018-19 – or a 5.4% dip.
Government: 12.5% share of local jobs vs. 13.1% in 2018-19, a 0.6-point decline. The 976,000 jobs are down 34,000 workers from 2018-19 – or a 3.4% dip.Jonathan Lansner is the business columnist for the Southern California News Group. He can be reached at [email protected]