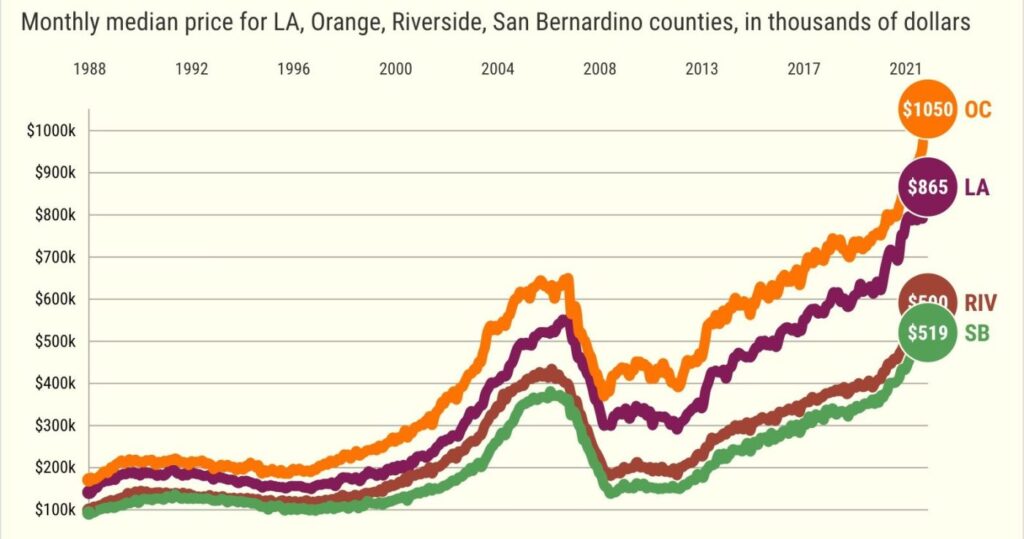
Orange County’s April home sales were down 28% from last year’s spring sales rush as record-high prices and soaring mortgage rates in April pushed the cost of buying 42% higher.
Across Southern California, 21,486 residences — single-family, condominium, existing and newly constructed homes — sold in six counties, down 8% for the month, and down 19% over the past year. The region’s median price of $760,000 was up 3% for the month, and up 17% over 12 months.
Pricier home loans saw a typical SoCal buyer get a house payment of $3,010 a month for the latest median vs. $2,191 a year ago on a $651,000 median. So prices rose 17% vs. a house payment’s 37% jump.
Here’s what my trusty spreadsheet found in DQNews’ report on closed transactions in April in Orange County …
Sales
The tally: 3,021 homes sold. This was the No. 25 busiest April of the 35 since 1988.
One-month change: 5% decrease from March. Since 1988, sales have fallen in this period 47% of the time with an average 1.4% increase from March.
One-year change: 28% decrease — No. 27 biggest decline since 1988 (or it’s been worse only 7% of the time.)
Pre-pandemic: April sales were 0.3% above the 3,012 average buying pace of the month, 2010-2019
Prices
The median: $1.05 million for all homes, up 2.9% in a month while increasing 21% over 12 months. This breaks the record $1.02 million median set in March.
One-month trend: Since 1988, prices have risen 54% of the time in April, with an average 1% gain.
One-year trend: Latest gain tops 93% of all 12-month periods since 1988.
Pandemic era: 16 price records have been broken since February 2020. The median’s $301,500 increase equals a gain of $15.84 every hour over these 26 months.
Key slices
Existing single-family houses: 1,947 sold, down 28% in a year. Median of $1.21 million — a 23% increase over 12 months.
Related Articles
Biggest jump ever: Southern California house payments up 37%, topping $3,000 a month
Bubble watch: Bitcoin, stocks crashed. Southern California home prices next?
Southern California home prices hit more records as rate hikes fail to slow bidding wars
Inland Empire homeownership soars to 18th in US; LA-Orange County at bottom
Orange County housing bubble: what do you remember?
Existing condos: 867 sales, down 26% over 12 months. Median of $750,000 — a 23% increase in a year.
Newly built: Builders sold 207 new homes, down 31% in a year. Median of $1.39 million — a 41.3% increase over 12 months.
Builder share: 6.9% of sales vs. 7.2% a year earlier.
Bigger picture
Across the region: All six Southern California counties had a sales drops for the month and the year. Prices rose in all counties in the month and the year.
Rates: How pricey has money become? Rates on a 30-year, fixed-rate mortgage averaged 4.3% in the three months ending in April vs. 2.98% a year earlier. That translates to 15% less buying power for house hunters. (Larger drops occurred only 3% of the time since 1971.)
Payment pain: Changing rates meant a buyer paid $4,159 a month for the $1.05 million April median-priced residence vs. paying $2,931 monthly on $871,000 median 12 months earlier. So prices rose 21% but the house payment soared 42%.
Downpayment: Those payment estimates assume 20% down, or $210,000 last month — up $35,800 since February 2020.
What sellers are thinking: In Los Angeles and Orange counties, the number of homes on the market fell 21.8% in the year — No. 41 of 50 metros tracked by Realtor.com. Inland Empire listings rose 23.3% — No. 1. L.A.-O.C. Listing prices fell 3.9% in 12 months — No. 43 of metros tracked by Realtor.com; I.E. asking prices rose 18.4% — No. 10.
Affordability: 8.3% of Los Angeles County met the affordability yardstick of the National Association of Home Builders in the first quarter — the lowest share nationally — vs. 11.7% of Orange County homes, the third-lowest, and 23.7% of Inland Empire homes, 15th worst.
Wall Street: The S&P 500 stock index in April was flat for the month vs. 2.9% gain for O.C. homes. One year? Stocks rose 6% vs. 20.6% home gain. Pandemic era? S&P 500 rose 34% vs. 40.3% home gain.
Quiz: Do you remember how bad the last countywide housing crash was? Take our quiz by CLICKING HERE!
Jonathan Lansner is the business columnist for the Southern California News Group. He can be reached at jlansner@scng.com
