“Bubble Watch” digs into trends that may indicate economic and/or housing market troubles ahead.
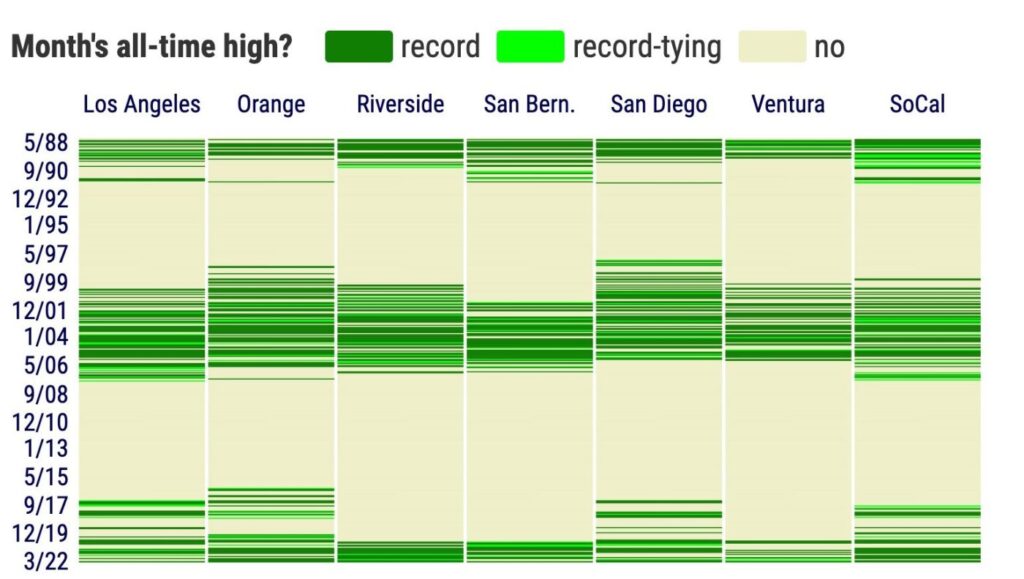
Buzz: It was a rare six-pack of all-time highs for median home sales prices in March in Southern California — only the second time in nearly 17 years the region saw new records in all six counties.
Source: My trusty spreadsheet analyzed DQNews’ monthly home pricing dating to 1988, tracking when prices peaked.
The Trend
March’s six-pack of record highs, by county included $1.02 million in Orange — the region’s first seven-figure median; $840,000 in Los Angeles; $805,000 in San Diego; $775,000 in Ventura; $580,000 in Riverside; and $495,000 in San Bernardino.
Universal record-setting has happened only in 19 months since 1988 — or 5% of the time over 34 years. Other than another pandemic era occurrence in June 2021, the last previous six-pack was in May 2005, as the last bubble neared a boiling point.
The other six-packs were among two bunches — the late 1980s (June 1988, July 1988, December 1988, March 1989, May 1989) and after the turn of the century (December 2001, June 2002, November 2002, May 2003, June 2003, August 2003, December 2003, and a four-month string between March and June 2004).
The Dissection
Record highs are more an emotional marker than a major market statistic, but it’s a real estate conversation starter that’s worth pondering. Look at the new price peaks of the pandemic era, by county — with a touch of long-term view …
Los Angeles: 12 records since March 2020 as the countywide median rose 35% in these 25 months to $840,000. Only 10 records were set in the previous 10 years.
Orange: 15 records as the median rose 36% to $1.02 million vs. 11 records in the previous 10 years.
Riverside: 16 records as the median rose 45% to $580,000 vs. no records in the previous 13 years.
San Bernardino: 12 records as the median rose 41% to $495,000 vs. no records in previous 13 years.
Related Articles
Bubble watch: California optimism at 10-month high despite war, inflation
Bubble watch: Southern California home prices 7% too high?
Bubble watch: Can California’s economy handle a real estate crash?
Bubble watch: How ‘real’ are California home-price gains?
San Diego: 12 records as the median rose 37% to $805,000 vs. 10 records in the previous 10 years.
Ventura: Eight records as the median rose 35% to $775,000 vs. no records in the previous 10 years.
And the six-county SoCal median? It has broken 16 records since coronavirus upset the economy as regional prices rose 36% to a record $735,000. In the previous 10 years, eight records were set.
How bubbly?
On a scale of zero bubbles (no bubble here) to five bubbles (five-alarm warning) … FOUR BUBBLES!
Southern California’s two spurts of widespread record-breaking in the past 34 years — and what followed — tells us such broad upward price momentum takes significant time to wear off. But when the surge is gone, it can take years to see new price peaks.
In the infamous bubble of the aughts, 12 six-pack months of all-time highs started in 2001 and ran through 2005. However, Southern California prices — as measured by the six-county median — didn’t start declining on a year-over-year basis until September 2007. And that downturn — a 51% loss, peak to trough — kept SoCal’s median from its next record high until December 2017.
And please do not forget the often-ignored 1988-89 price boom and its unraveling. Its five months of across-the-board new highs turned into declining regional prices by April 1992. That era’s reversal — a 19% dip, top to bottom — meant it wasn’t until May 1999 before another all-time high was set.
So will it be different this time?
Jonathan Lansner is the business columnist for the Southern California News Group. He can be reached at jlansner@scng.com
