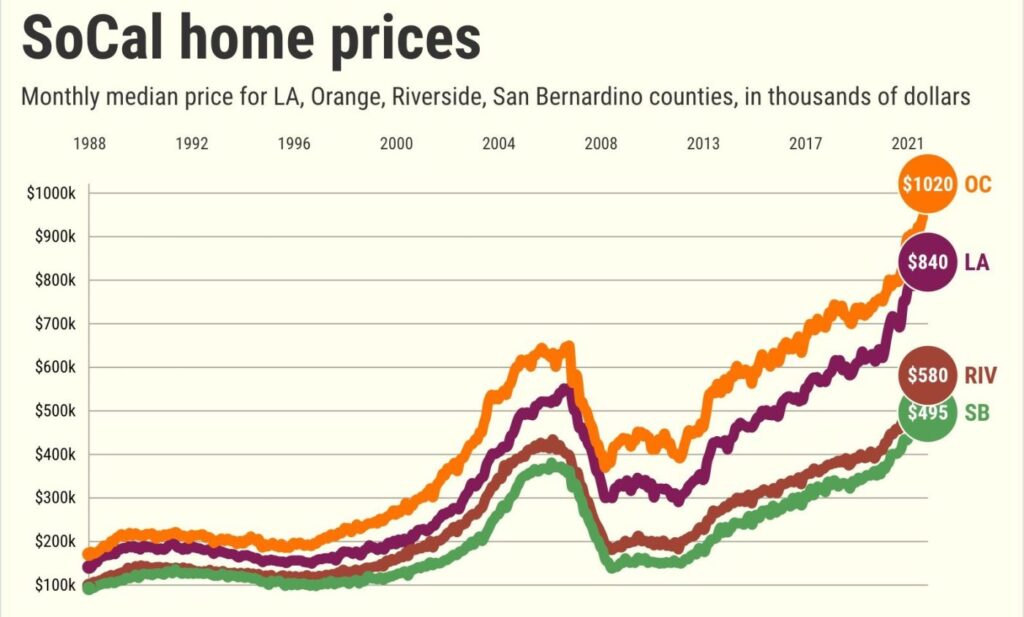
Orange County’s median home price in March cracked seven figures for the first time at $1.02 million — the 15th record high set in the pandemic era.
Across Southern California, the median home price of $735,000 also was an all-time high — up 4% for the month and 17% over 12 months. Buyers grabbed 23,225 residences — existing and newly constructed — in the six counties, up 37% for the month but down 9% over the past year.
Here’s what my trusty spreadsheet found in DQNews’ report on closed transactions in Orange County in March …
Prices
The month: The countywide $1,020,000 median for all homes was up 3.6% in a month while increasing 22% over 12 months. This breaks the record of $985,000 set in January.
One-month trend: 3.6% increase. Since 1988, prices have risen 86% of the time between February and March, with an average 2.1% gain.
One-year trend: The latest performance tops 95% of all 12-month periods since 1988.
10 years: 9.8% annualized gains.
Pandemic era? 15 price records have been broken since February 2020. The median’s $271,500 increase equals a gain of $14.84 every hour over these 25 months.
Sales
The month: 3,184 existing and new residences sold, up 43.6% from February and down -19% from 2021.
How fast? This was the No. 24 busiest March of the 35 since 1988.
Past decade: 4% above the 10-year average buying pace for March.
Monthly trend: Since 1988, March has never seen a one-month sales with an average 38% increase from February.
Related Articles
Got an extra $646 a month? Southern California’s new homebuying pain
More home price records set in all 6 Southern California counties, despite rising rates
Orange County median home price tops $1 million for the first time
Bubble watch: Can California’s economy handle a real estate crash?
What would a bubble mean for house hunters?
Past 12 months? 40,199 Orange County purchases — 13% above the previous 12 months and 14% above the 10-year average.
Key slices
Existing single-family houses: 1,938 sold, down 19% in a year. Median of $1.2 million — a 28% increase over 12 months.
Existing condos: 1,007 sales, down 14% over 12 months. Median of $750,000 — a 30% increase in a year.
Newly built: Builders sold 239 new homes, down 30% in a year. Median of $1.28 million — a 49% increase over 12 months.
Builder share: 7.5% of sales vs. 8.7% a year earlier.
Bigger picture
Rates: How cheap is money? Rates on a 30-year, fixed-rate mortgage averaged 3.79% in the three months ending in March vs. 2.88% a year earlier. That translates to 11% less buying power for house hunters. (Larger drops occurred only 7% of the time since 1971.)
Pandemic era: Changing rates meant a buyer paid $3,799 a month for the $1.02 million median-priced residence vs. $2,723 on pre-virus February 2020’s $748,500 median. So prices rose 36% vs. a house payment’s 39% increase.
Downpayment: Those payment estimates assume 20% down — that was $204,000 last month, up $54,300 since February 2020.
Supply: Listings in Los Angeles-Orange County are off 27% in a year, according to Realtor.com. — the 11th biggest drop of 50 major U.S. metro areas. But the Inland Empire supply of homes for sale was up 18% — the largest gain in the nation.
Affordability: Just 8% of L.A. County homes can fit a local household’s budget, says the National Association of Realtors — the smallest share in the nation. Orange County? Third-lowest at 12%. Inland Empire? No. 17 at 22%.
Jonathan Lansner is the business columnist for the Southern California News Group. He can be reached at jlansner@scng.com
