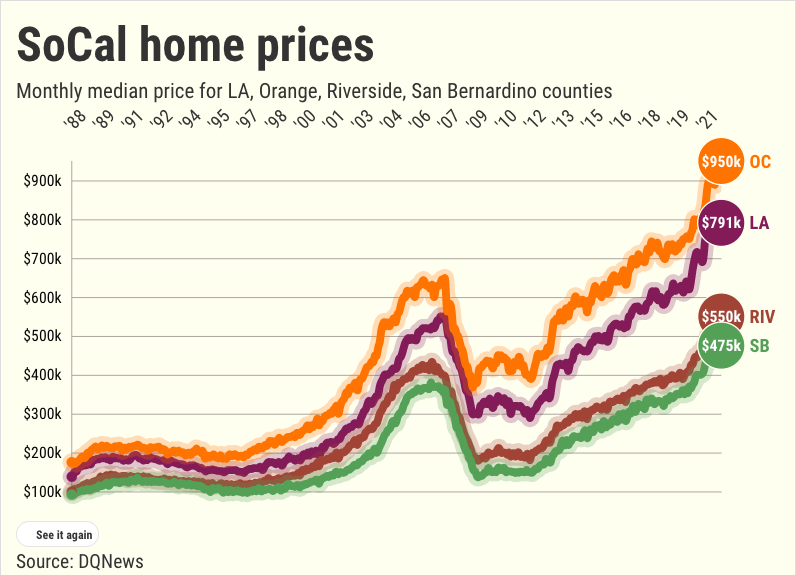
Orange County’s pandemic-era homebuying binge pushed its median selling price to yet another record as its nears the $1 million mark.
Across Southern California, 16,905 existing and newly constructed homes sold in six counties, up 2% for the month and down 8% over the past 12 months. The region’s median price cracked the $700,000 barrier in just 15 months, hitting $706,000 — up 3% for the month, and up 15% over 12 months.
Here’s what my trusty spreadsheet found in DQNews’ report on closed transactions in Orange County in February …
Prices
The month: The countywide $985,000 median for all homes was up 3.7% in a month while increasing 20% over 12 months. This broke the record $950,000 set in January.
One-month trend: Since 1988, February prices have risen 63% of the time, with an average 1.6% gain.
One year: Latest performance tops 92% of all 12-month periods since 1988.
10 years: 9.7% annualized gains.
Pandemic era? 14 price records broken since February 2020. The median’s $236,500 increase equals a gain of $13.46 every hour over these 24 months.
Sales
The month: 2,217 existing and new residences sold, up 1% from January and down 19% from 2021.
How fast? The 23rd busiest February of the 35 since 1988.
Past decade: 1% below the 10-year average pace for February.
Related Articles
Bubble watch: Southern California home prices break $700,000 barrier in 15 months
Bubble watch: California doubles housing demands to 2.5 million by 2030
Orange County home prices hit record $950,000, up $201,500 in pandemic era
Did the pandemic kill homeownership?
Orange County housing adds 16 million-dollar ZIPs, loses 13 ‘bargain’ neighborhoods
Monthly trend: Since 1988, a typical February sees a one-month sales increase 65% of the time with an average 3.7% rise from January.
Past 12 months? 40,712 Orange County purchases — 15% above the previous 12 months and 16% above the 10-year average.
Key slices
Existing single-family houses: 1,340 sold, down 20% in a year. Median of $1,167,000 — a 28% increase over 12 months.
Existing condos: 662 sales, down 18% over 12 months. Median of $720,000 — a 21% increase in a year.
Newly built: Builders sold 215 new homes, down 14% in a year. Median of $949,000 — a 2.6% increase over 12 months.
Builder share: 9.7% of sales vs. 9.1% a year earlier.
Bigger picture
Rates: How cheap is money? Rates on a 30-year, fixed-rate mortgage averaged 3.44% in the three months ending in February vs. 2.74% a year earlier. That translates to 8% less buying power for house hunters. (Larger drops occurred only 16% of the time since 1971.)
Pandemic era: Changing rates meant a buyer paid $3,511 a month for the $985,000 February median-priced home vs. $2,723 on pre-virus February 2020’s $748,500 median. So prices rose 32% vs. a house payment’s 29% increase.
Downpayment: Those payment estimates assume 20% down — that was $197,000 last month, up $32,970 in a year.
Supply: Realtor.com found a curious split in February. L.A.-Orange County listings were down 34% in a year, the ninth-biggest drop among the 50 largest metros while Inland Empire supply rose 6% — the largest gain in the nation.
Affordability: “From a home price/down payment perspective, is the worst it’s ever been, meaning extreme barriers to entry,” according to a recent Bank of America research note.
Jonathan Lansner is the business columnist for the Southern California News Group. He can be reached at jlansner@scng.com
