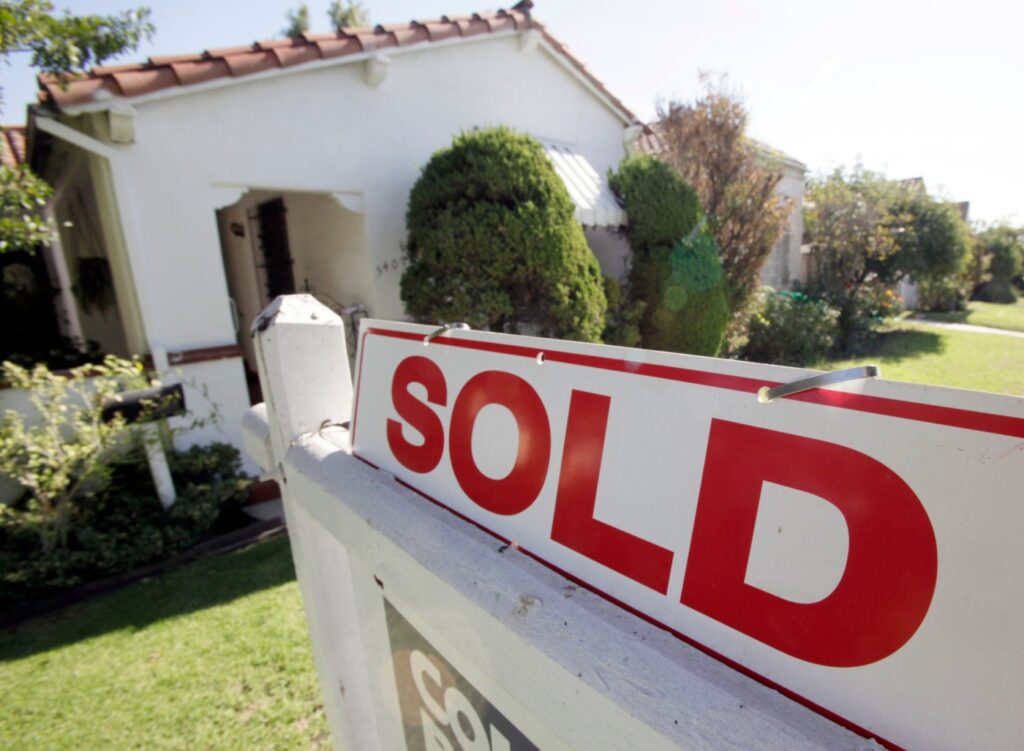
Southern California homebuying got off to a slow start in January with both prices and sales dipping.
The pace of closed transactions cooled from December, according to DQNews data released Wednesday, Feb. 16. The median sales price in the six-county region also fell slightly to $687,000 from an all-time high of $695,000.
Rising mortgage rates likely contributed to the housing chill, yet pricing remained relatively firm due to a limited number of homes to buy.
Here are 14 trends that help explain January’s cooling. Was it a seasonal shift or the start of a deeper freeze?
Let’s start by dissecting the six-county area’s monthly sales pace dip. DQNews stats show 16,461 new and existing homes and condos sold, down 28% in a month and 8% in a year …
1. Monthly trend? A new year’s dip comes as no surprise. Since 1988, every year has started with slower homebuying — an average 27% decrease from December.
2. How fast? It was still the 14th-busiest January of the 35 since 1988. Sales were 10% above the 10-year average buying pace for January.
3. Past 12 months? Using a long-term view, 280,794 SoCal homes sold since February 2021 — that’s a hearty appetite 20% above the previous 12 months and 20% above the 10-year average.
4. By county? January sales were down in all six counties for the month and over 12 months. Ventura had the biggest one-month dip — off 32% and down 18% in a year, followed by San Diego (off 31% month, 7% year); Los Angeles (off 29% month; 6% year); Riverside (off 27% month, 2% year); Orange (off 26% month, 15% year); and San Bernardino (off 23% month, 10% year).
5. Newly built? Local builders didn’t help much, selling only 1,227 residences, down 12% in a year. New construction is a dwindling house hunter option, representing 7.5% of all January sales vs. 7.8% a year earlier and 13% since 1988. Median price? $660,500 — an 18% increase over 12 months.
Now let’s ponder January’s pricing, down 1.2% for the month but up 15.5% in a year …
6. One-month trend? The fall from December’s record high of $695,000 should be no surprise. Since 1988, prices have never risen from December to January, instead, averaging a 2.7% drop. On a yearly basis, the median price was up for the 115th time out of the last 118 months — that’s nearly 10 years.
7. 12-month trend? January marked the 18th consecutive month of double-digit, year-over-year price gains — the longest streak since a 22-month run ending in June 2014. The year’s 15.5% gain tops 83% of all 12-month periods since 1988 and is also well above the 10% annual average gain of the past decade.
8. Price records? No new high for the region’s median in January after 15 price records were broken since February 2020. At the county level, Orange was January’s lone new record at $950,000. Record-tying prices were seen in Riverside at $550,000 and San Diego at $750,000.
9. By county? Prices fell in four counties for the month but rose for the year in all six. L.A. was off 2% for the month but up 15% for a year. San Bernardino was off 2% for the month and up 17% for a year. Ventura was off 1% for the month but up 15% for a year. Riverside was flat for the month and up 21% for a year. San Diego was up 1% for the month and up 17% for a year. Orange was up 2% for the month and 19% for a year.
How tight is the market? Look at one-year changes in inventory data from Realtor.com …
10. Homes on the market? L.A.-O.O., 41% fewer official listings, the ninth-biggest drop of 50 largest metropolitan areas; San Diego, down 39%; 11th biggest drop; Inland Empire, down 12%, seventh-smallest drop.
11. Days on market? L.A.-O.C., 19% fewer days, 14th biggest drop; San Diego, 8%, 18th smallest drop; and Inland Empire, 6% fewer days, 12th smallest drop.
Related Articles
Company accused of cheating Southern California cities out of millions in building fees
Perks of selling a home could outweigh challenges of buying
Anaheim’s worst Angel Stadium error came year before its murky sale
Property owners in selling mood face expenses vs. profits
How a tiny-home movement is putting more than just a roof over the homeless
And what about a year ahead with the prospects of even pricier borrowing rates …
12. How much higher already? Rates on a 30-year, fixed-rate mortgage averaged 3.21% in the three months ending in January vs. 2.74 a year earlier. That translates to 6% less buying power for house hunters.
13. Payment impact? At current rates, a buyer with 20% down would have paid $2,379 monthly on January’s $687,000 median vs. a year earlier’s $1,938 house payment on the $595,000 median. That’s a 23% jump in the mid-range house’s theoretical loan payments.
14. How unaffordable? In two years, the pandemic’s escalating home prices have narrowed the share of households that can “afford” the local median-priced house, according to the California Association of Realtors. In O.C., that share fell to 17% vs. 26% two years earlier; L.A. 21% vs. 27%; San Diego 23% vs. 29%; Ventura 24% vs. 31%; Riverside 32% vs. 41%; and in San Bernardino 42% vs. 51%.
Jonathan Lansner is the business columnist for the Southern California News Group. He can be reached at jlansner@scng.com
