“Bubble Watch” digs into trends that may indicate economic and/or housing market troubles ahead.
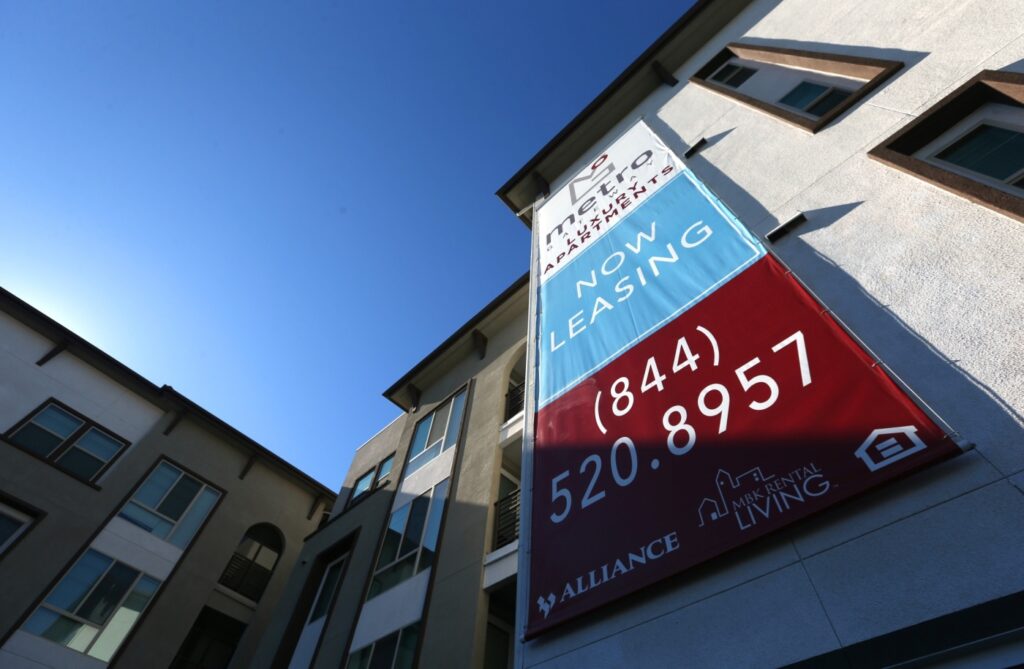
Buzz: Tenants are feeling pinched as Southern California rent hikes grow at a pace not seen since 1985.
Source: My trusty spreadsheet analyzed a personal favorite benchmark for tracking what landlords are charging — the local Consumer Price Index’s “rent of primary residence” data. I looked at what you might call “momentum” — specifically, six-month changes in the 12-month rent inflation pace dating back to 1980.
The Trend
The CPI for Los Angeles and Orange counties shows rent expenses were growing at a 3.4% annual rate in January. That may seem modest, if not understated, but it is quite the jump from the 0.8% pace in the pandemic-iced economy of July 2020.
This 2.6 percentage-point surge in the rent-hike pace over six months hasn’t been seen since the crazy inflation days of the 1980s. There were just two instances of 3-point surges in rent hikes in a half-year: October 1985 (to 9.8% from 6.8%) and March 1980 (to 13.3% from 10.3%).
Remember, rent CPI comes from a survey of consumers asking how much they paid landlords, from mom-and-pop-owners with a few units to real estate giants with massive apartment complexes. And the CPI’s “what did you pay?” question includes the realities of annual rent renewals — typically smaller increases than what landlords demand from new tenants.
The Dissection
Quibble all you want about CPI methodology — much of the criticism comes from folks who sell competing data — but the six-month jump trend is an eye-opening bit of history.
By the way, it’s not just a local twist: the U.S. CPI’s rent index rose 1.9 percentage points to 3.8% in January from 1.9% in July. That’s the largest boost in the rent hikes since 1980!
It’s a shocking turn of events because when looking at the bottom of these same rankings — six-month periods with the biggest decline in rents hikes — the pandemic era is there, too.
Three of the 10 largest drops in the rent-hike pace since 1980 came in late 2020. Remember when as the economy was first digesting pandemic pain and vaccinations were still largely a dream?
October 2020 saw a 2.7-point drop (tied for No. 9 largest fall) to 1.8% annualized rent hikes from 4.5%; November 2020, 2.8-point drop (No. 8) — to 1.6% from 4.4%; and December 2020, 2.7-point drop (also No. 9) — to 1.3% from 4%.
Consider how swiftly the cycle went from a chilled economy and job losses (no rent payments) to landlords prevented from evicting them (moratoriums) to a recovering economy with enough oomph to increase rents at a pace not seen in 37 years.
By the way, it’s not just a local twist: the U.S. rent index rose 1.9 percentage points to 3.8% in January from 1.9% in July. That’s the largest boost in the rent hikes since 1980!
How bubbly?
On a scale of zero bubbles (no bubble here) to five bubbles (five-alarm warning) … FIVE BUBBLES!
The pandemic era’s rent-hike turnabout — from historic lows to top of the charts — suggests there are many locals with good-paying jobs and/or cash to pay these higher rents.
At the same time, the big hikes raise a troubling question: What about the folks who are struggling to pay bills when we’re in an inflation spike we haven’t seen since the 1980s?
Related Articles
Bubble watch: California homes could be 9% overvalued
Bubble watch: California optimism up 4 straight months
Bubble watch: Orange County house payments up 10% despite cheap mortgages
Bubble watch: House payments soar 13% despite record-cheap mortgages
Bubble watch: Mortgage rates soar despite promises of mild uptick
And what does surging inflation mean? Interest rates — especially for mortgages — are rising. Freddie Mac’s average 30-year rate is up over a full point from January 2021’s historic bottom at 2.65%. That affects house hunting and many landlords, because they have mortgages, too.
I’m betting the rent CPI’s measured upswing will continue to show even larger increases in the coming months. And since housing’s the biggest chunk of the overall CPI, inflation rates will remain elevated.
Remember, the L.A.-O.C. rose at a 7.5% pace in January, the highest since 1982. And the Inland Empire CPI — split off from the rest of Southern California in 2018 — rose to 8.6% — highest in its three-year history — fueled by a 6% hike in rents.
Jonathan Lansner is the business columnist for the Southern California News Group. He can be reached at jlansner@scng.com
