
It was a dry year with a wet ending.
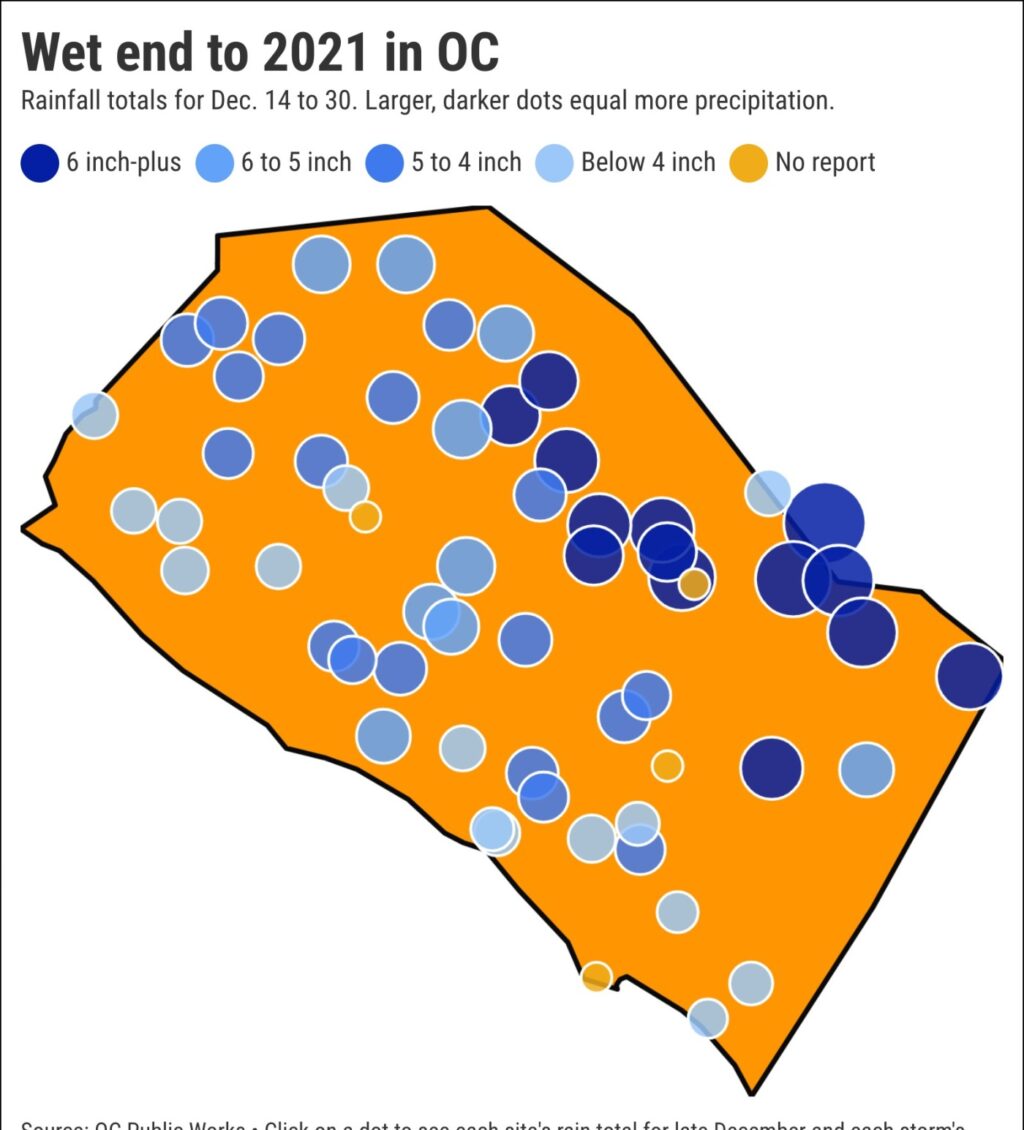
The map below reflects how much rain fell in Orange County in a series of late 2021 storms, compiled from readings by OC Public Works at 56 sites countywide from Dec. 14-30.
In the year’s wet ending, the storms hit hardest in the eastern foothills: Upper Silverado Canyon (11.93 inches); Upper Harding Canyon (10.01 inches); Santiago Peak (8.86 inches); Holy Jim Canyon (8.5 inches); El Cariso Guard Station (7.92 inches); and Santiago Creek at E08 (7.85 inches).
On the map, a dot’s color and size reflect the rainfall total. Click on the dots on the map to see an individual site’s totals and how much rain fell in individual storm periods.
Jonathan Lansner is the business columnist for the Southern California News Group. He can be reached at jlansner@scng.com
Related Articles
LA County cities break rainfall records Thursday
Mapped: Orange County’s wettest spots in Dec. 29-30’s rain
Grapevine reopens after strong storm leads to road closures, mudslide and wrecks around the region
Highway 18 to San Bernardino Mountains remains closed causing travel woes amid storm
Record-breaking cold hits Anaheim, Newport Beach, other spots in LA and Orange counties